DATA ANALYTICS
Internship 2025
1/ 2 Months
Online
8+ Live Projects
Dual Certification
Ultimate Step towards your Career Goals: Expert in Data Analytics
Get ahead with the FutureTech Industrial Internship Program: gain hands-on experience, connect with industry leaders, and develop cutting-edge skills. Earn a stipend, receive expert mentorship, and obtain a certificate to boost your career prospects. Transform your future with practical, real-world learning today
Internship Benifits
Mentorship
Receive guidance and insights from industry experts.
Hands-on Experience
Gain practical skills in a real-world cutting-edge projects.
Networking
Connect with professionals and peers in your field.
Skill Development
Enhance your technical and soft skills.
Career Advancement
Boost your resume with valuable experience.
Certificate
Get a certification to showcase your achievements.
Data Analytics Internship Overview
This outline provides a structured approach to mastering data analysis and visualization, combining powerful tools like Excel, Tableau, Power BI, and Python. You’re all set to transform data into meaningful insights! Ready to dive in?
Key Highlights:
Excel Pivot Tables
Formatting Data: How to format data using pivot tables.
Sorting, Filtering, and Grouping: Techniques for organizing data.
Data Visualization Tools – Tableau
- Installation and First Visualization: Step-by-step guide to installing Tableau and creating your first visualization.
Data Visualization Tools – Power BI
Installation and First Visualization: Guide to installing Power BI and creating initial visualizations.
Python for Data Science
Basics and Installation: Introduction to Python and setting up your environment.
Data Structures: Understanding data structures for data science.
Excel Pivot Tables
Introduction to Pivot Tables: Overview and basic operations.
Formatting Data: How to format data using pivot tables.
Sorting, Filtering, and Grouping: Techniques for organizing data.
Enriching Data: Using calculated fields and other enrichment techniques.
Visualizing Data: Creating visual representations with pivot tables.
Case Studies:
Analyzing salary data.
Analyzing stock market data.
Tracking daily weather conditions.
Data Visualization Tools – Tableau
Installation and First Visualization: Step-by-step guide to installing Tableau and creating your first visualization.
Advanced Techniques:
Using calculated fields and bins.
Creating complex visualizations.
Using joins for data integration.
Full Project: Implementing a comprehensive project in Tableau.
Data Visualization Tools – Power BI
Installation and First Visualization: Guide to installing Power BI and creating initial visualizations.
Advanced Features:
Using Power Query.
Managing relationships in Power BI.
Utilizing DAX functions.
Drill-down techniques.
Conditional formatting, bins, and lists.
Popular visualizations.
Project: Completing a full project in Power BI.
Python for Data Science
Basics and Installation: Introduction to Python and setting up your environment.
Data Structures: Understanding data structures for data science.
Fundamental Programming: Core programming concepts in Python.
Data Analysis:
Pandas: Data manipulation and analysis.
NumPy: Numerical operations.
Matplotlib & Seaborn: Data visualization.


Looking for in-depth Syllabus Information? Explore your endless possibilities in Data Analytics with our Brochure!
share this detailed brochure with your friends! Spread the word and help them discover the amazing opportunities awaiting them.
Project Submission: Example Output Screenshots from Our Clients
Take a look at these sample outputs crafted by our clients. These screenshots showcase the impressive results achieved through our courses and projects. Be inspired by their work and visualize what you can create!


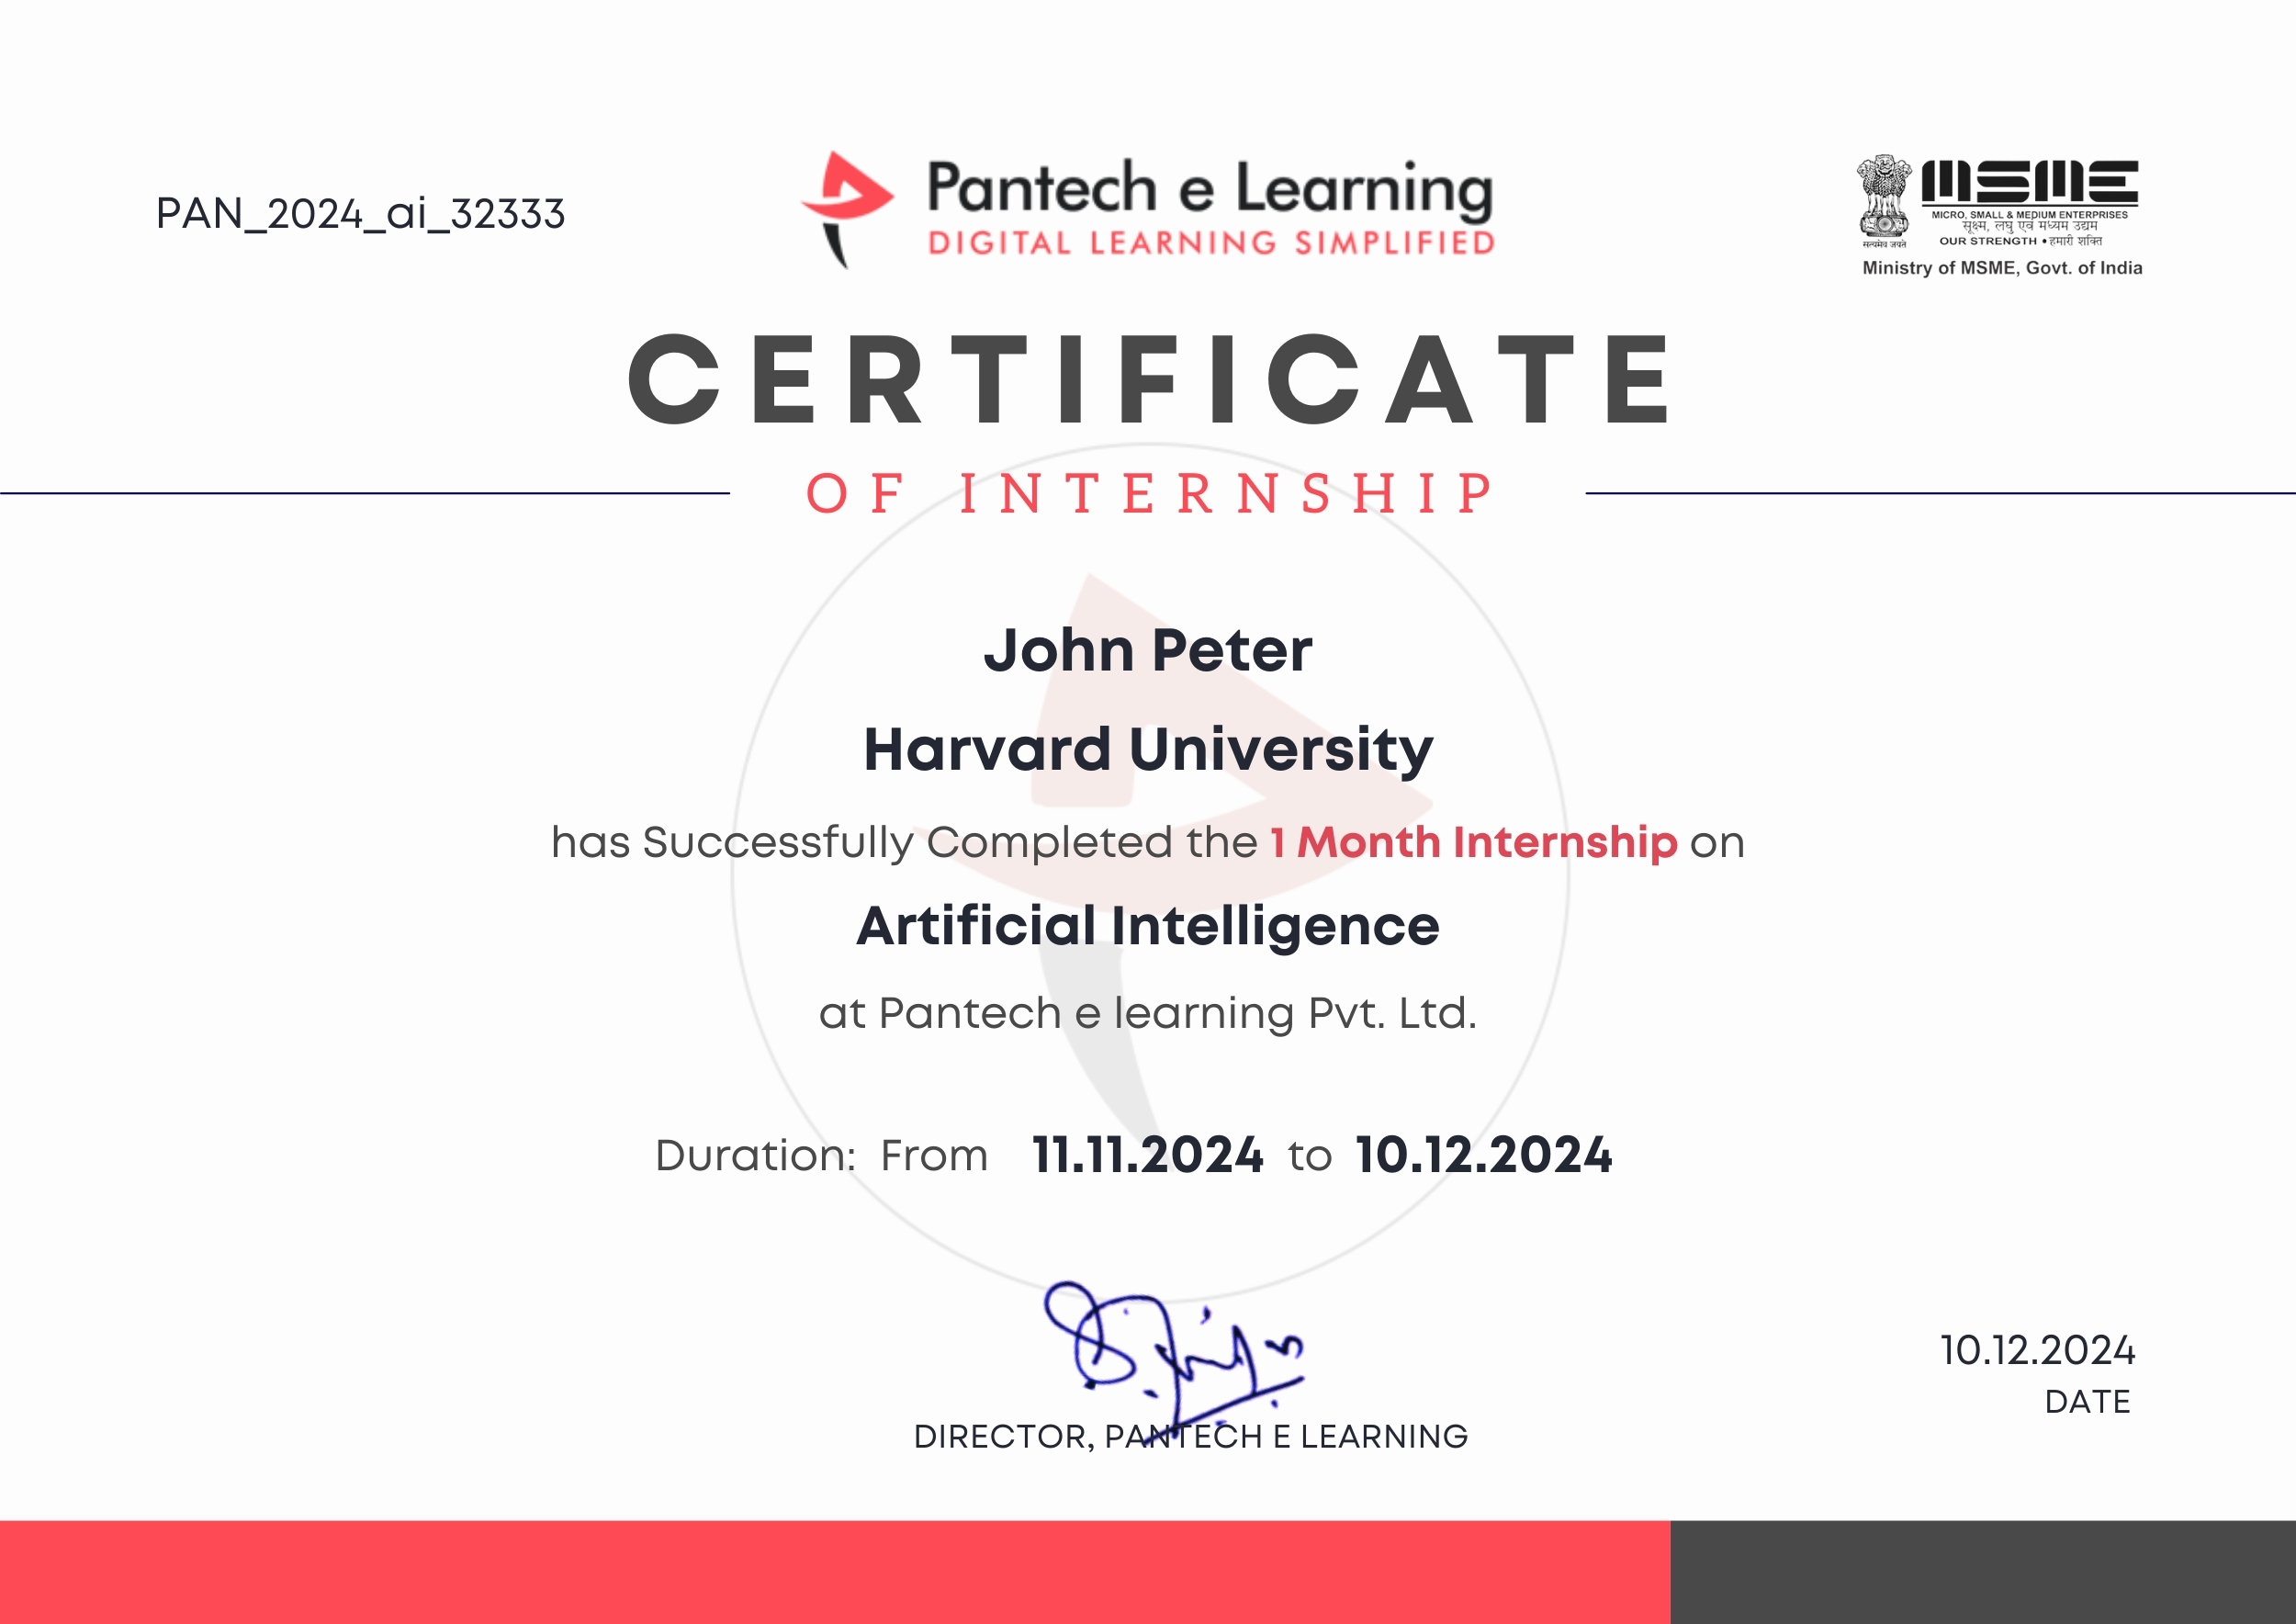
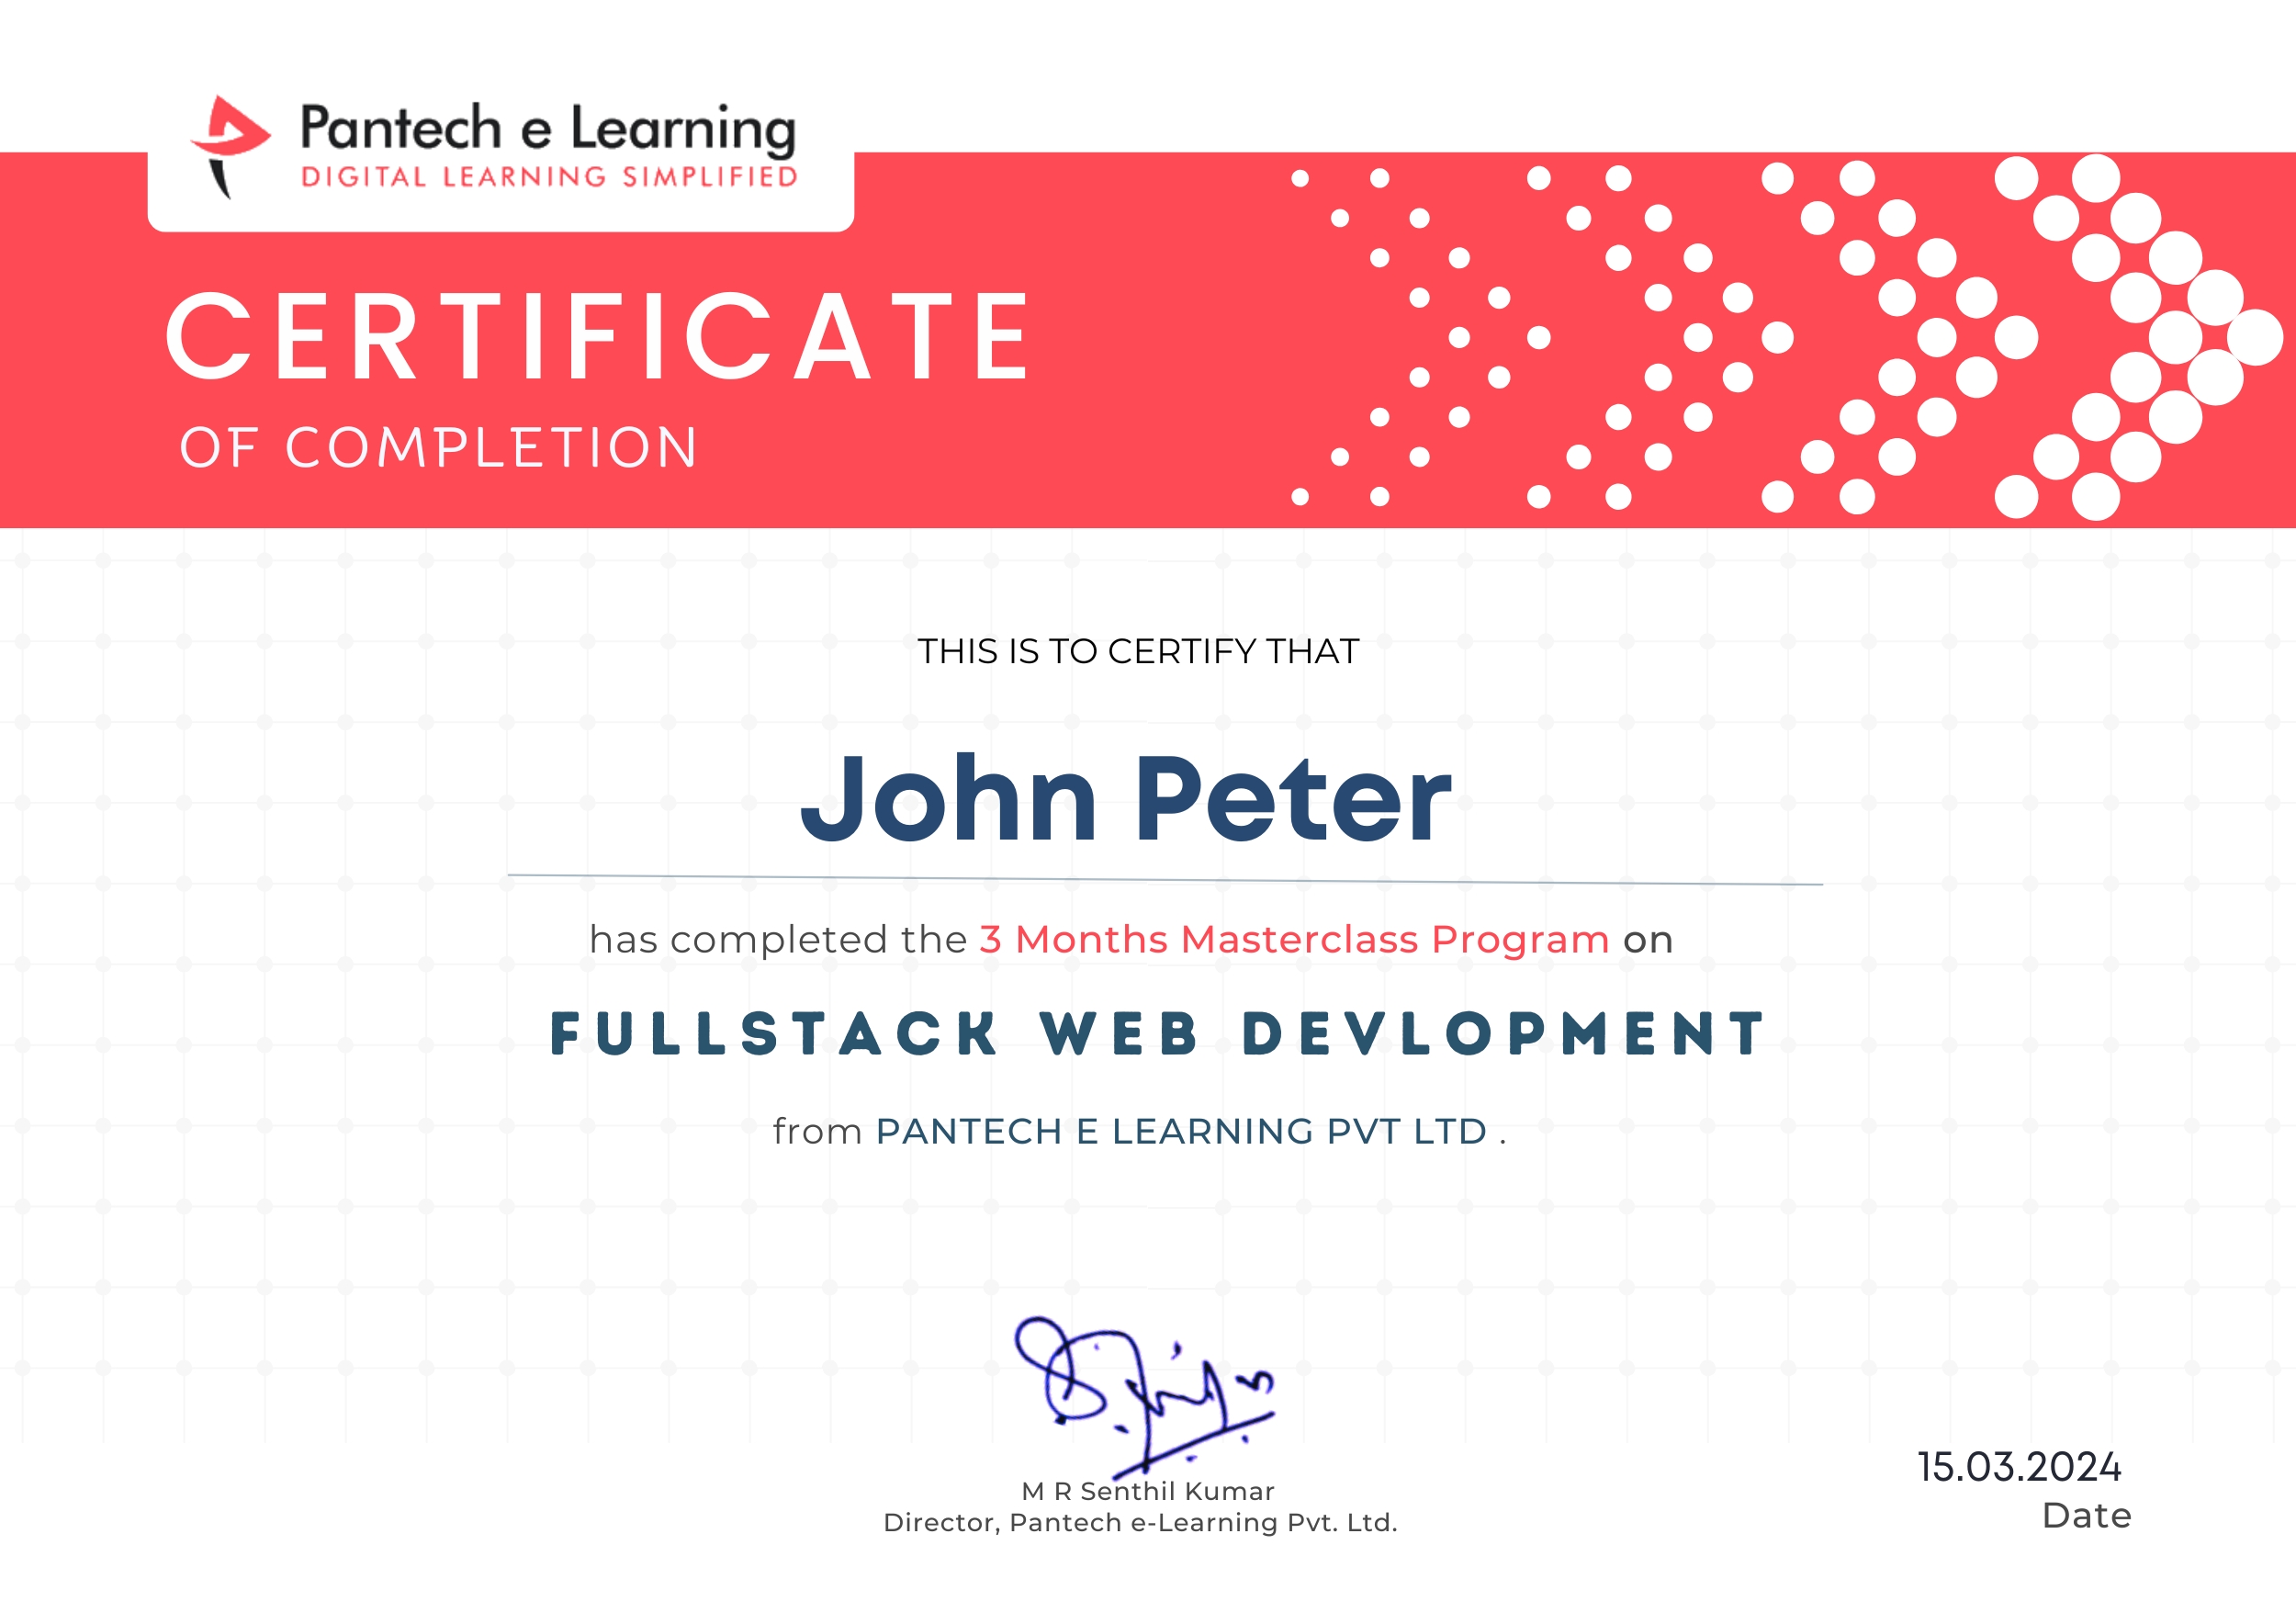
Dual Certification: Internship Completion & Participation
Earn prestigious Dual Certification upon successful completion of our internship program. This recognition validates both your participation and the skills you have honed during the internship


How does this Internship Program Work?
Step 1 Enroll in the Program
- Get a Mentor Assigned
- Presentations & Practice Codes
- Learn at your Flexible Time
- Apprehend the concepts
Step 2 Project Development
- Implement Skills Learn
- Develop Projects with assistance
- Get Codes for Reference
- Visualise the Concepts
Step 3 Get Certified
- Certificate of Internship
- Project Completion Certificate
- Share on social media
- Get Job Notifications
Choose Your Plan fit your needs
Master the Latest Industrial Skills. Select a technology domain & kick off your Internship immediately.
1 Month
₹1999/-
₹999/-
- Internship Acceptance Letter
- 90 Days from the date of payment
- 4 LIVE intractive Mastermind Sessions
- 4+ Capstone Projects & Codes
- Full Roadmap
- Internship Report
- 1 Month Internship Certificate
2 Month
₹3299/-
₹1899/-
- Internship Acceptance Letter
- 180 Days from the date of payment
- 4 LIVE interactive Mastermind Sessions
- 12+ Capstone Projects & Codes
- Full Roadmap
- Internship Report
- Participation Certificate
- 2 Month Internship Certificate
Our Alumni Employers
Curious where our graduates make their mark? Our students go on to excel in leading tech companies, innovative startups, and prestigious research institutions. Their advanced skills and hands-on experience make them highly sought-after professionals in the industry.


EXCELLENTTrustindex verifies that the original source of the review is Google. I recently completed my Python internship under the guidance of Mentor poongodi mam We learnt so many new things that developed my knowledge.this experience is good to learnTrustindex verifies that the original source of the review is Google. I completed my python internship guidance of mentor poongodi mam. She thought us in friendly qayTrustindex verifies that the original source of the review is Google. Poongodi mam done very well She took the class very well When we ask any doubt without getting bored she will explain,we learned so much from mam,marvelousTrustindex verifies that the original source of the review is Google. I have handled by poongodi mam.domain python intership...was goodTrustindex verifies that the original source of the review is Google. I recently completed Python internship under the guidance of poongodi mam who excelled in explaining concepts in an easily understandable wayTrustindex verifies that the original source of the review is Google. Fantastic class we were attended..we got nice experience from this class..thank you for teaching python mam...Trustindex verifies that the original source of the review is Google. -The course content was well-structured - I gained valuable insights into microcontrollers, sensors, and programming languages- The workshop was informative, interactive, and challenging, pushing me to think creatively. Ms Jimna our instructor her guidance and feedback helped me overcome obstacles and improve my skills.Trustindex verifies that the original source of the review is Google. The learning experience was really worth since more than gaining just the knowledge all of the inputs were given in a friendly and sportive manner which then made it a good place to learn something with a free mindset... 👍🏻Trustindex verifies that the original source of the review is Google. I recently completed my full stack python intership under the guidance of mentor Gowtham,who excelled in explaining concepts in an easily understand mannerTrustindex verifies that the original source of the review is Google. Gowtham-very interesting class and I learning so many things in full stack python development and I complete my internship in Pantech e learning and it is useful for my career
FAQ
What is a Data Analyst's day-to-day job?
Answer:
A data analyst’s daily tasks may include:
- Collecting and cleaning data from various sources.
- Writing SQL queries to extract data from databases.
- Analyzing data using statistical methods and creating reports.
- Developing dashboards and visualizations to communicate insights.
- Collaborating with stakeholders to understand business needs.
- Generating insights that can drive business strategies and decisions.
What is the role of Data Analytics in business?
Answer:
Data analytics plays a crucial role in decision-making across various industries by helping businesses:
- Understand customer behavior: Identifying patterns and preferences.
- Optimize operations: Improving efficiency and reducing costs.
- Predict trends: Anticipating market shifts or consumer demand.
- Measure performance: Tracking key performance indicators (KPIs) and ROI.
- Support strategic planning: Making informed decisions based on data-driven insights.
What is Big Data in Data Analytics?
Answer:
Big Data refers to extremely large datasets that are too complex for traditional data-processing methods. These datasets typically have the “3 Vs”:
- Volume: The amount of data.
- Velocity: The speed at which data is generated and needs to be processed.
- Variety: The different types of data (structured, unstructured, etc.).
How do you clean data in Data Analytics?
Answer:
Data cleaning involves several steps:
- Handling Missing Values: Impute or drop missing data points.
- Removing Duplicates: Ensure there is no redundant data.
- Outlier Detection: Identify and deal with outliers that may skew analysis.
- Data Standardization: Normalize data formats, units, or representations.
- Correcting Errors: Fix or remove incorrect or inconsistent data entries.
What is the difference between Data Analytics and Data Science?
Answer:
While both fields work with data, the main difference lies in the scope and complexity of tasks:
- Data Analytics is typically focused on analyzing and interpreting historical data to inform decision-making. It’s more about extracting actionable insights from data.
- Data Science involves more advanced techniques like machine learning, statistical modeling, and big data technologies. Data scientists often build models and algorithms to predict future outcomes or automate decisions.
What tools do data analysts use?
Answer:
- Excel: For basic data analysis and reporting.
- SQL: For querying relational databases.
- Python & R: For data manipulation, analysis, and visualization.
- Tableau/Power BI: For creating interactive dashboards and visualizations.
- Google Analytics: For web analytics.
- Apache Hadoop & Spark: For big data processing and analytics.
- Jupyter Notebooks: For interactive coding and data analysis.
Start Your Tech Journey Today
Sign Up for Exclusive Resources and Courses Tailored to Your Goals!
© 2025 pantechelearning.com

