Data Science Bootcamp
Unlock the power of Data science with this comprehensive course. From basics to advanced techniques, dive into data manipulation and visualization using industry-standard libraries.
Data Science From Basics to Data Visualization
This course offers an in-depth exploration of Python programming tailored for data science. Start with foundational concepts, progress through essential libraries like NumPy, Pandas, and Matplotlib, and advance to data cleaning, preprocessing, and visualization. Perfect for beginners and experienced programmers alike.
Master Python, NumPy, Pandas, and Matplotlib for data science.
Python for Data Science
an in-depth exploration of Python programming tailored for data science. Start with foundational concepts, progress through essential libraries like NumPy, Pandas, and Matplotlib
Data Analytics Fundamentals
Learn to analyze and interpret data with statistical methods and visualization tools. Build a strong foundation in data analytics to drive informed decision-making

Machine Learning Techniques
The core concepts of machine learning with practical examples and projects. Learn to build and deploy machine learning models using various algorithms.
Data Visualization with Power BI and Tableau
Start with foundational concepts, progress through essential libraries like NumPy, Pandas, and Matplotlib, and advance
Abstract
- Introduction to Python
- Data Types and Variables Control
- Structures Functions and Modules Libraries: NumPy, Pandas, Matplotlib Data
- Cleaning and
- Preprocessing Data
- Visualization
- Introduction to Data Analytics
- Descriptive Statistics Data Collection and Cleaning Exploratory
- Data Analysis (EDA)
- Data Visualization Tools
- Hypothesis Testing
- Regression Analysis
- Introduction to Machine Learning
- Supervised vs. Unsupervised Learning
- Linear and Logistic Regression
- Decision Trees and Random Forests
- Support Vector Machines (SVM)
- Clustering Algorithms
- Neural Networks and Deep Learning
- Introduction to Data Visualization
- Getting Started with Power BI
- Data Import and Transformation in Power BI
- Creating Interactive Dashboards
- Introduction to Tableau Building Visualizations in Tableau
- Advanced Visualization Techniques
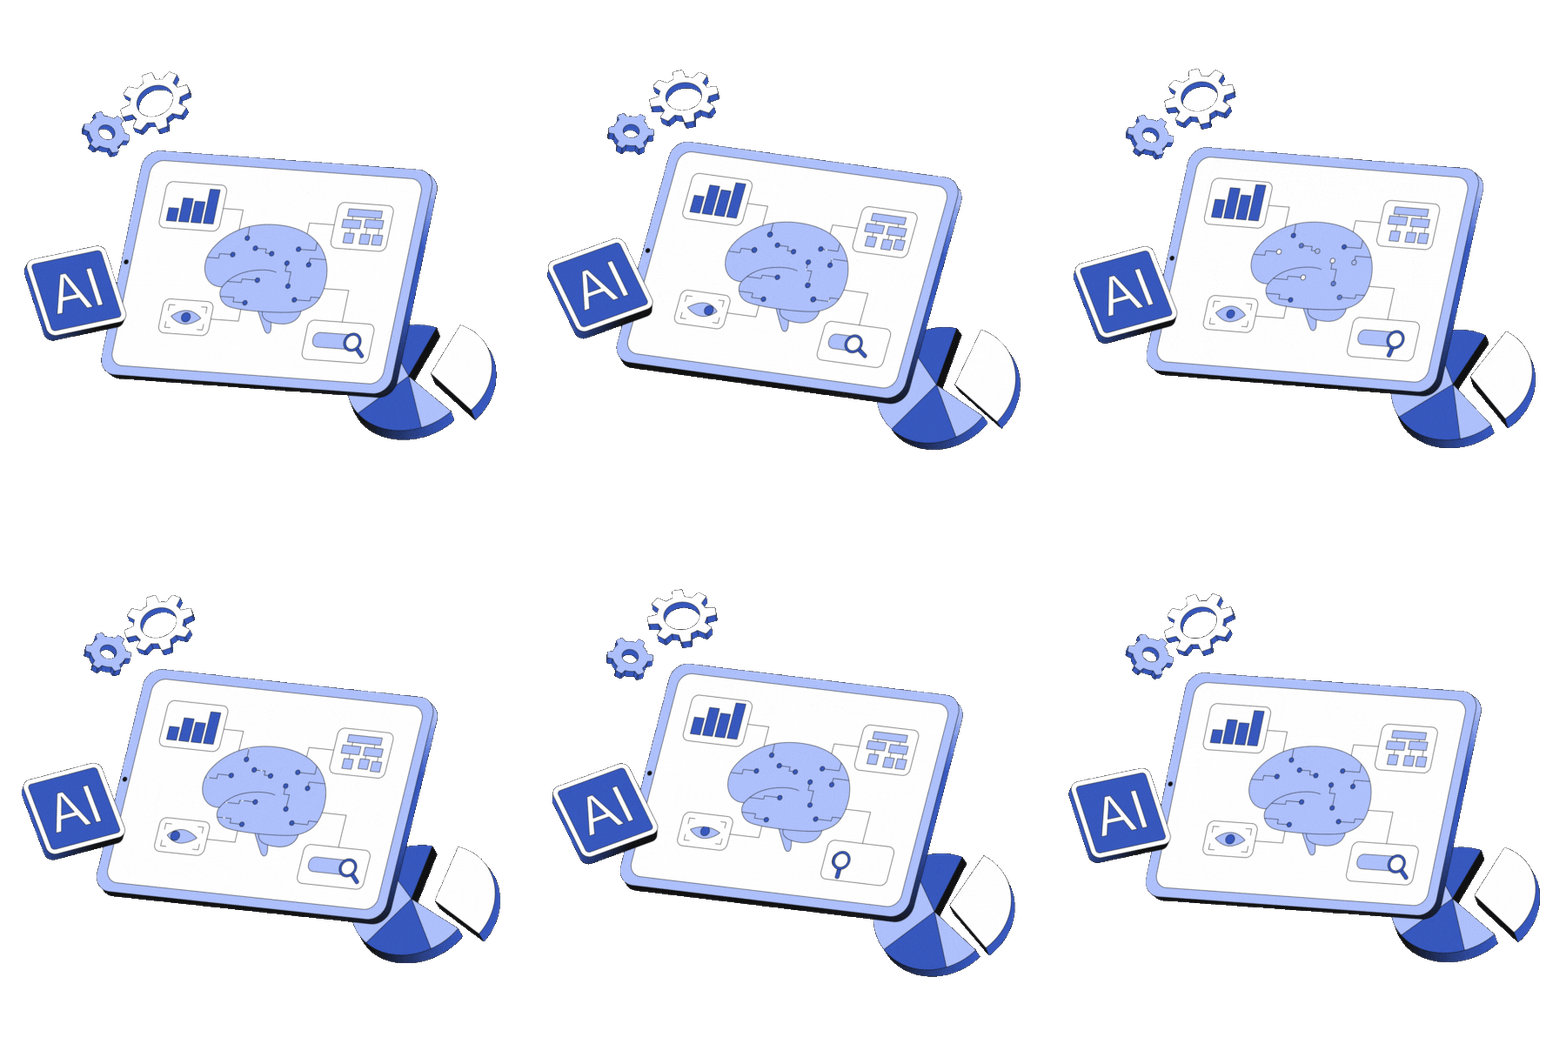
Project Description
outlining the key components and workflow for an advanced autonomous navigation system

Data Acquisition
The Lidar collects 360-degree mapping data.
o The camera captures images for vision-based measurements.
o The obstacle detection sensors identify nearby objects to avoid
collisions.
Data Processing
The Raspberry Pi processes sensor data in real-time using Python and pre-trained models for object detection and path planning.

Decision Making
The bot determines the safest and most efficient path to move forward while avoiding obstacles.

Real-Time Navigation
The motor driver controls the high-torque motors, enabling smooth and precise movement based on the processed data.
Global Data Science Statistics
According to LinkedIn, data science jobs have a high demand with a 37% increase in hiring annually.
The Bureau of Labor Statistics reports that the employment of data scientists is projected to grow by 15% from 2020 to 2030, much faster than the average for all occupations.
Glassdoor ranks Data Scientist as one of the best jobs with a job satisfaction rating of 4.0 out of 5.0
- Data Scientists with 1-3 years of experience can expect an average salary of 8 LPA-12 LPA in India.